Google Chrome
To capture a detailed network trace using your browser's DevTools, follow these steps:
-
Open the Chrome DevTools:
- Select
F12 - Select
Ctrl+Shift+I(Windows/Linux) orCommand+Option+I(macOS) - Select
Customize and control Google Chromeand thenMore Tools > Developer Tools
- Select
-
Select the
NetworkTab -
Refresh the page (if needed) and reproduce the problem
-
Select the
Export HAR...in the toolbar to export the trace as a "HAR" file
To capture a detailed network trace using your browser's DevTools, follow these steps:
-
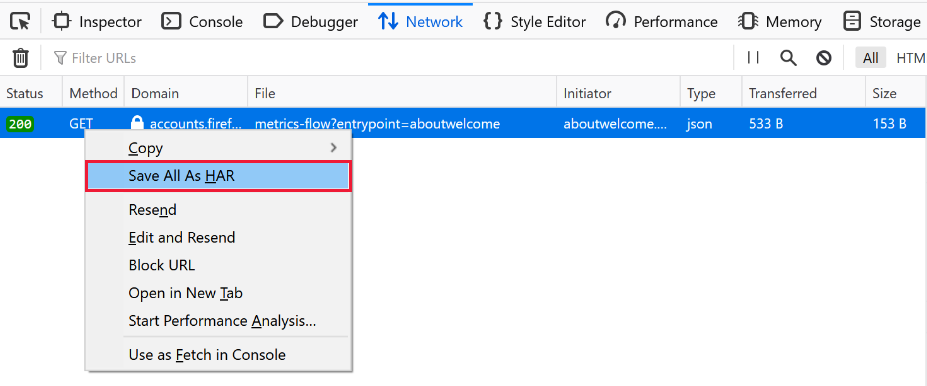
Open the Firefox Developer Tools:
- Select
F12 - Select
Ctrl+Shift+I(Windows/Linux) orCommand+Option+I(macOS) - Select
Open menuand thenWeb Developer > Toggle Tools
- Select
-
Select the
NetworkTab -
Refresh the page (if needed) and reproduce the problem
-
Right-click anywhere in the list of requests and choose "Save All As HAR"
To capture a detailed network trace using your browser's DevTools, follow these steps:
- Open the Web Development Tools:
- Select
Command+Option+I - Select
Developermenu and then selectShow Web Inspector
- Select
- Select the
NetworkTab - Refresh the page (if needed) and reproduce the problem
- Right-click anywhere in the list of requests and choose "Save All As HAR"
Microsoft Edge (Chromium)
To capture a detailed network trace using your browser's DevTools, follow these steps:
-
Open the DevTools:
- Select
F12 - Select
Ctrl+Shift+I(Windows/Linux) orCommand+Option+I(macOS) - Select
Settings and moreand thenMore Tools > Developer Tools
- Select
-
Select the
NetworkTab -
Refresh the page (if needed) and reproduce the problem
-
Select the
Export HAR...in the toolbar to export the trace as a "HAR (HTTP Archive)" file